Thursday, September 23, 2010

Magic numbers for 24th Sep


I'm interested get your feedback, Most important you'll get profit exit before 11am most of time.

To apply this number plz read : http://axtamoney.blogspot.com/2010/09/magic-numbers.html

Update @ 10AM:

Ster 5mins' HIGH / LOW - 173.85 / 172.10 difference - 1.75 (Magic No 1.54) 
Trade Action : Sold @ 172.30 SL 173.85 Tgt 170.75
Result : met tgt1 170.80

Kotakbank: 5 min's H/L 483.75 / 478 Difference -  5.75 (Magic No 6.22)
Trade Action: Buy Abv 484.25 (478+6.22) Sl 478 Tgt 490 / 496
Result: Made High 487.90 but maintained up trend till end


MAGIC NUMBERS

On based on stocks volatility I have developed Magic number for each stock, this numbers will work out exactly and applying is very easy.If you know to read candles that is very much enough to apply this magic numbers.

This works as follow:

Any stock's open 5mins candle's (9.05AM) difference (High - Low) If matches with Magic number, then you can expect break out either-side and trend will be multiples of the Magic Number
 
For example: 
  • Magic number for KOTAKBANK for the day is - 5.64 (It will be published pre- market in blog)
  • 9.05AM candle's HIGH /LOW - 494.90 / 489.25 ; the difference is 494.90-489.25 = 5.65 (Magic No 5.64)
  • Now, its simple to trade: Buy above 494.90 SL 489.25 Tgt (494.90+5.65 = 500.65)
  • Sell below 489.25 SL 494.90 Tgt1 (489.25 -5.65 = 483.60); Tgt2 (483.60 - 2.825 = 480.75)
  • No magic it happened on 23rd Sep, Day's Low 481.25 & after broken 489.25 it never went up for 495; Check with yourself.
  • It will give 90% success for Intraday.
  • Simple but it's up to you to apply.
  • Please note, not all stocks' 5 mins candles give breakout, only candles which match with Magic numbers will give result.
  • You can apply magic number with 2mins candle or day's first Swing.
  • Any doubt please mail me @ rajeshvravanappan@gmail.com
Magic number developed by my own analysis and it is not copied or adapted from any site or author  


calls update 23RD Sep

Wednesday, September 22, 2010

calls update 22nd Sep

 
*HDFC rates @ 700+

Tuesday, September 21, 2010

Calls update 21st Sep

Monday, September 20, 2010

Calls Update 20th Sep

Saturday, September 18, 2010

Test My Performance

I have developed own trading tool and its working out profitably for Intraday. 

If you want to check my performance, send any 20 days closing price.. (don't mention name of the stock or commodity.)and 21st days first 5 min candles Open, High, low and close... Ill give you back the probable result of  how the stock would been moved on 21st day..
 

Any Exchange, any stock /commodity.. 

mail me rajeshvravanappan@gmail.com


.

Thursday, September 16, 2010

Calls Update 16th Sep

Wednesday, September 15, 2010

Calls Update 15th Sep

Tuesday, September 14, 2010

Nifty Hourly Chart Update

Calls Update - Open Hours 14th Sep

 For 1 lac order value: Calls update till 10.30 AM

Friday, September 10, 2010

Intraday Simple Strategy - 50 EMA Cross Over

Hi,
This is one more simple Intraday Strategy, no need of any indicators or oscillators.

We need:
1. Stocks crossed 50 EMA (EOD) and closed within 1% deviate from 50 EMA. (Both break up & Break down)
2. Use 50 EMA as strict SL for your Intraday Enrty

Example:
On 9th Sep 2010, SIEMENS closed @ 710.35, and 50 EMA is 708.61

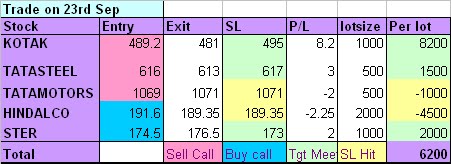
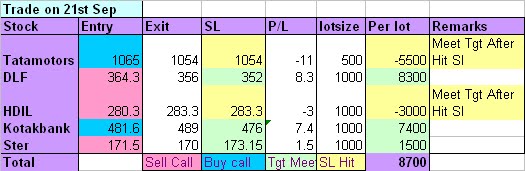
Trading Strategy for 13th Sep:
  •  Check open Candle's open n low, If low not breached 708.61, go long with SL of 50EMA (708.60);
  • Suppose open Candle breaches 50 EMA omit trade or take Pivot supports to your Chance.
  • Make Sure different between EMA & your Entry should be less than 1%
  • Expected Return 2%
  • If stock closed below 50 EMA, Go short
You will get this filter from http://www.stocksfortune.com/QTAnalysisG

For a day, you will get around 5 Derivative stocks in each side Bull /Bear

No urge, Just watch open candle for all 10 stocks, who obey our condition enter with strict SL.. IF 50EMA works Resistance / Support, Hold position you can expect 2% & more return within 2 days.

You can apply this strategy for any EMA / SMA (30, 50,100 or 200 Days)

Happy Trading

Friday, September 3, 2010

DLF Positional Call

Wednesday, September 1, 2010

IntraDay Bollinger Band - Simple Strategy

Hi,

I have came across this link : http://www.youtube.com/watch?v=vHvOVDBEmZs

Hope this will work out in Intraday and we can aim for handsome profit..

My Observation For NSE Stocks:

1. Take 20 SMA & Bollinger Band 20 reading
2. Consider 2 days High / Low
3. Use Hourly Charts

On 3rd day, on break of 2 days High/Low within Bandwidth, enter your position (Long / Short) with SL of 20 SMA; I have checked with few of NSE Stocks..

Investors can check this and apply for positional trade, this is very simple and useful strategy according to me

ADs

  © Blogger templates Shiny by Ourblogtemplates.com 2008

Back to TOP